Observing the World Alzheimer's Month #2 - current research on nanoScan PET/MRI 1T
18F-FDG-PET Detects Drastic Changes in Brain Metabolism in the Tg4–42 Model of Alzheimer’s Disease
Caroline Bouter1, Philipp Henniges2, Timon N. Franke2, Caroline Irwin2, Carsten Oliver Sahlmann1, Marius E. Sichler2, Nicola Beindorff3, Thomas A. Bayer2 and Yvonne Bouter2
1Department of Nuclear Medicine, University Medical Center Göttingen (UMG), Georg-August-University, Göttingen, Germany
2Division of Molecular Psychiatry, Department of Psychiatry and Psychotherapy, University Medical Center Göttingen (UMG), Georg-August-University, Göttingen, Germany
3Berlin Experimental Radionuclide Imaging Center (BERIC), Charité—University Medicine Berlin, Berlin, Germany
https://doi.org/10.3389/fnagi.2018.00425
Summary
The authors have used one of the latest mouse Alzheimer’s Disease (AD) models (Tg4-42 transgenic mutation, which overexpresses the Ab4-42 peptide, which is truncated on the N-terminal region, causing neurotoxicity and Ab aggregation, which are similar to AD). As the AD patients show altered glucose metabolism, the authors chose to follow it with the most common radiopharmaceutical used in PET, namely 18F-FDG, and how it can be used together with the MRI as an early biomarker for AD.
They have found that Tg4-42 mice show a reduction of glucose-metabolism, which correlates with their age, and the decreased 18F-FDG uptake can be shown in early age (3 months).
Results from nanoScan PET/MRI 1T
For the PET/MRI studies, the authors have used a nanoScan PET/MRI 1T, which could provide a fast measurement method together with good statistics. Young (3-4 months) and aged (7-8 months) Tg4-42 (n=7, female) and aged WT C57Bl/6J (7-8 months, n=5, female) control mice were used in this study. The authors have followed the standard 18F-FDG PET/MRI protocol, as the mice were fasted overnight, and 9-21 MBq activity was injected into the tail vein, with a 45 minute long uptake period.
The PET scans were performed for 20 minutes , which was followed by a Tera-Tomo 3D reconstruction method with a 0.3 mm3. For the MRI, the authors have used GRE sequence as a material map for attenuation and scatter correction in the PET reconstruction, and as a brain atlas. The analysis was performed with PMOD software.
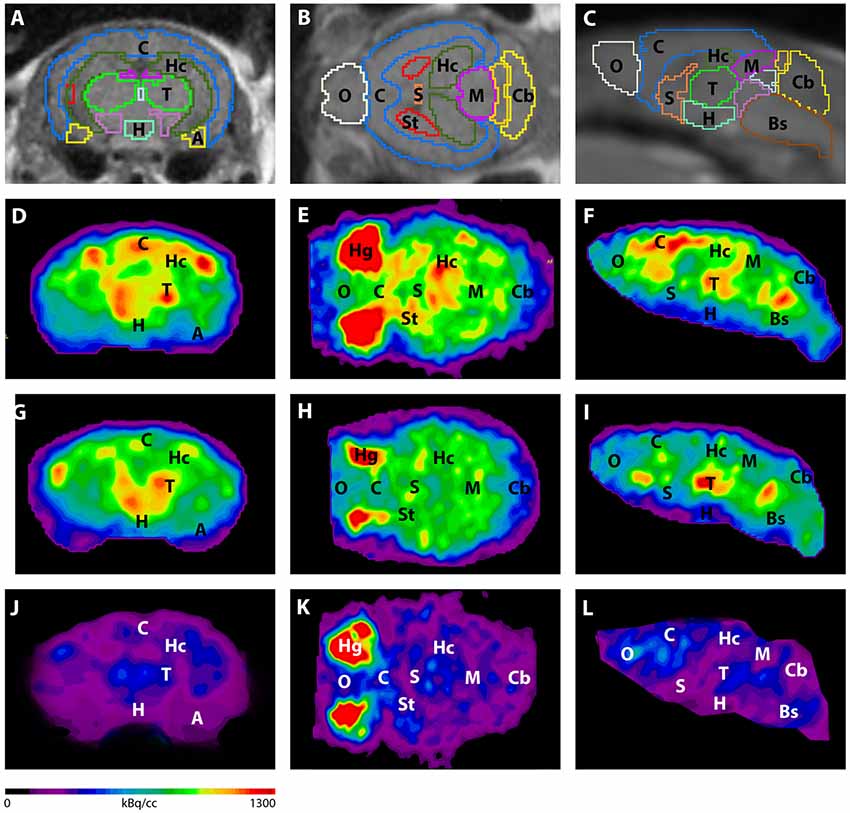
Figure 3. shows the main results from the PET/MRI acquisitions: a-c) MRI images were matched with predefined brain regions; axial, coronal and sagittal view. d-f) 18F-FDG-PET images of a WT mouse. g-i) 18F-FDG-PET images of a young Tg4–42 mouse. j-l) 18F-FDG-PET images of an aged Tg4–42 mouse. A, Amygdala; Bs, Brain Stem; C, Cortex; Cb, Cerebellum; H, Hypothalamus; Hc, Hippocampus; Hg, Harderian glands; M, Midbrain; O, Olfactory Bulb; S, Septum/Basal Forebrain; St, Striatum; T, Thalamus.
- These results suggest that 18F-FDG uptake was distinctly lower in aged Tg4–42 mice compared to WT mice. In young Tg4–42 mice 18F-FDG the uptake did not show significant differences in whole brain uptake but it was reduced in the hippocampus, forebrain, hypothalamus, amygdala and midbrain.
- The study showed that Tg4-42 can be a useful AD model to monitor the effects of various therapeutic strategies in vivo using 18F-FDG uptake as a therapeutic readout.

Related Posts
Comments
By accepting you will be accessing a service provided by a third-party external to https://medisousa.com/

